Classification Metrics: Visual Explanations
Table Of Contents
This post will visually describe the problem of understanding of such concepts as Accuracy, Precision, Recall, F1-Score, ROC Curve, and AUC, which are part of the development of any classification, detection, segmentation, etc. tasks in machine learning. All the images were created by the author.
I would also suggest you read the following articles about those metrics, which are highly informative and could give you a better understanding of the metrics evaluation process:
- Classification: True vs. False and Positive vs. Negative
- Classification: Accuracy
- Classification: ROC Curve and AUC
- Precision and Recall Made Simple
- Evaluating Classification Models: Why Accuracy Is Not Enough
- Precision and Recall: Understanding the Trade-Off
- Essential Things You Need to Know About F1-Score
- Understanding the AUC-ROC Curve in Machine Learning Classification
- Precision & Recall
- ROC & AUC
The Key Element
The key element of all these metrics is True Positive (TP), True Negative (TN), False Positive (FP), and False Negative (FN) metrics, which came from Statistics, specifically from Hypothesis Testing.

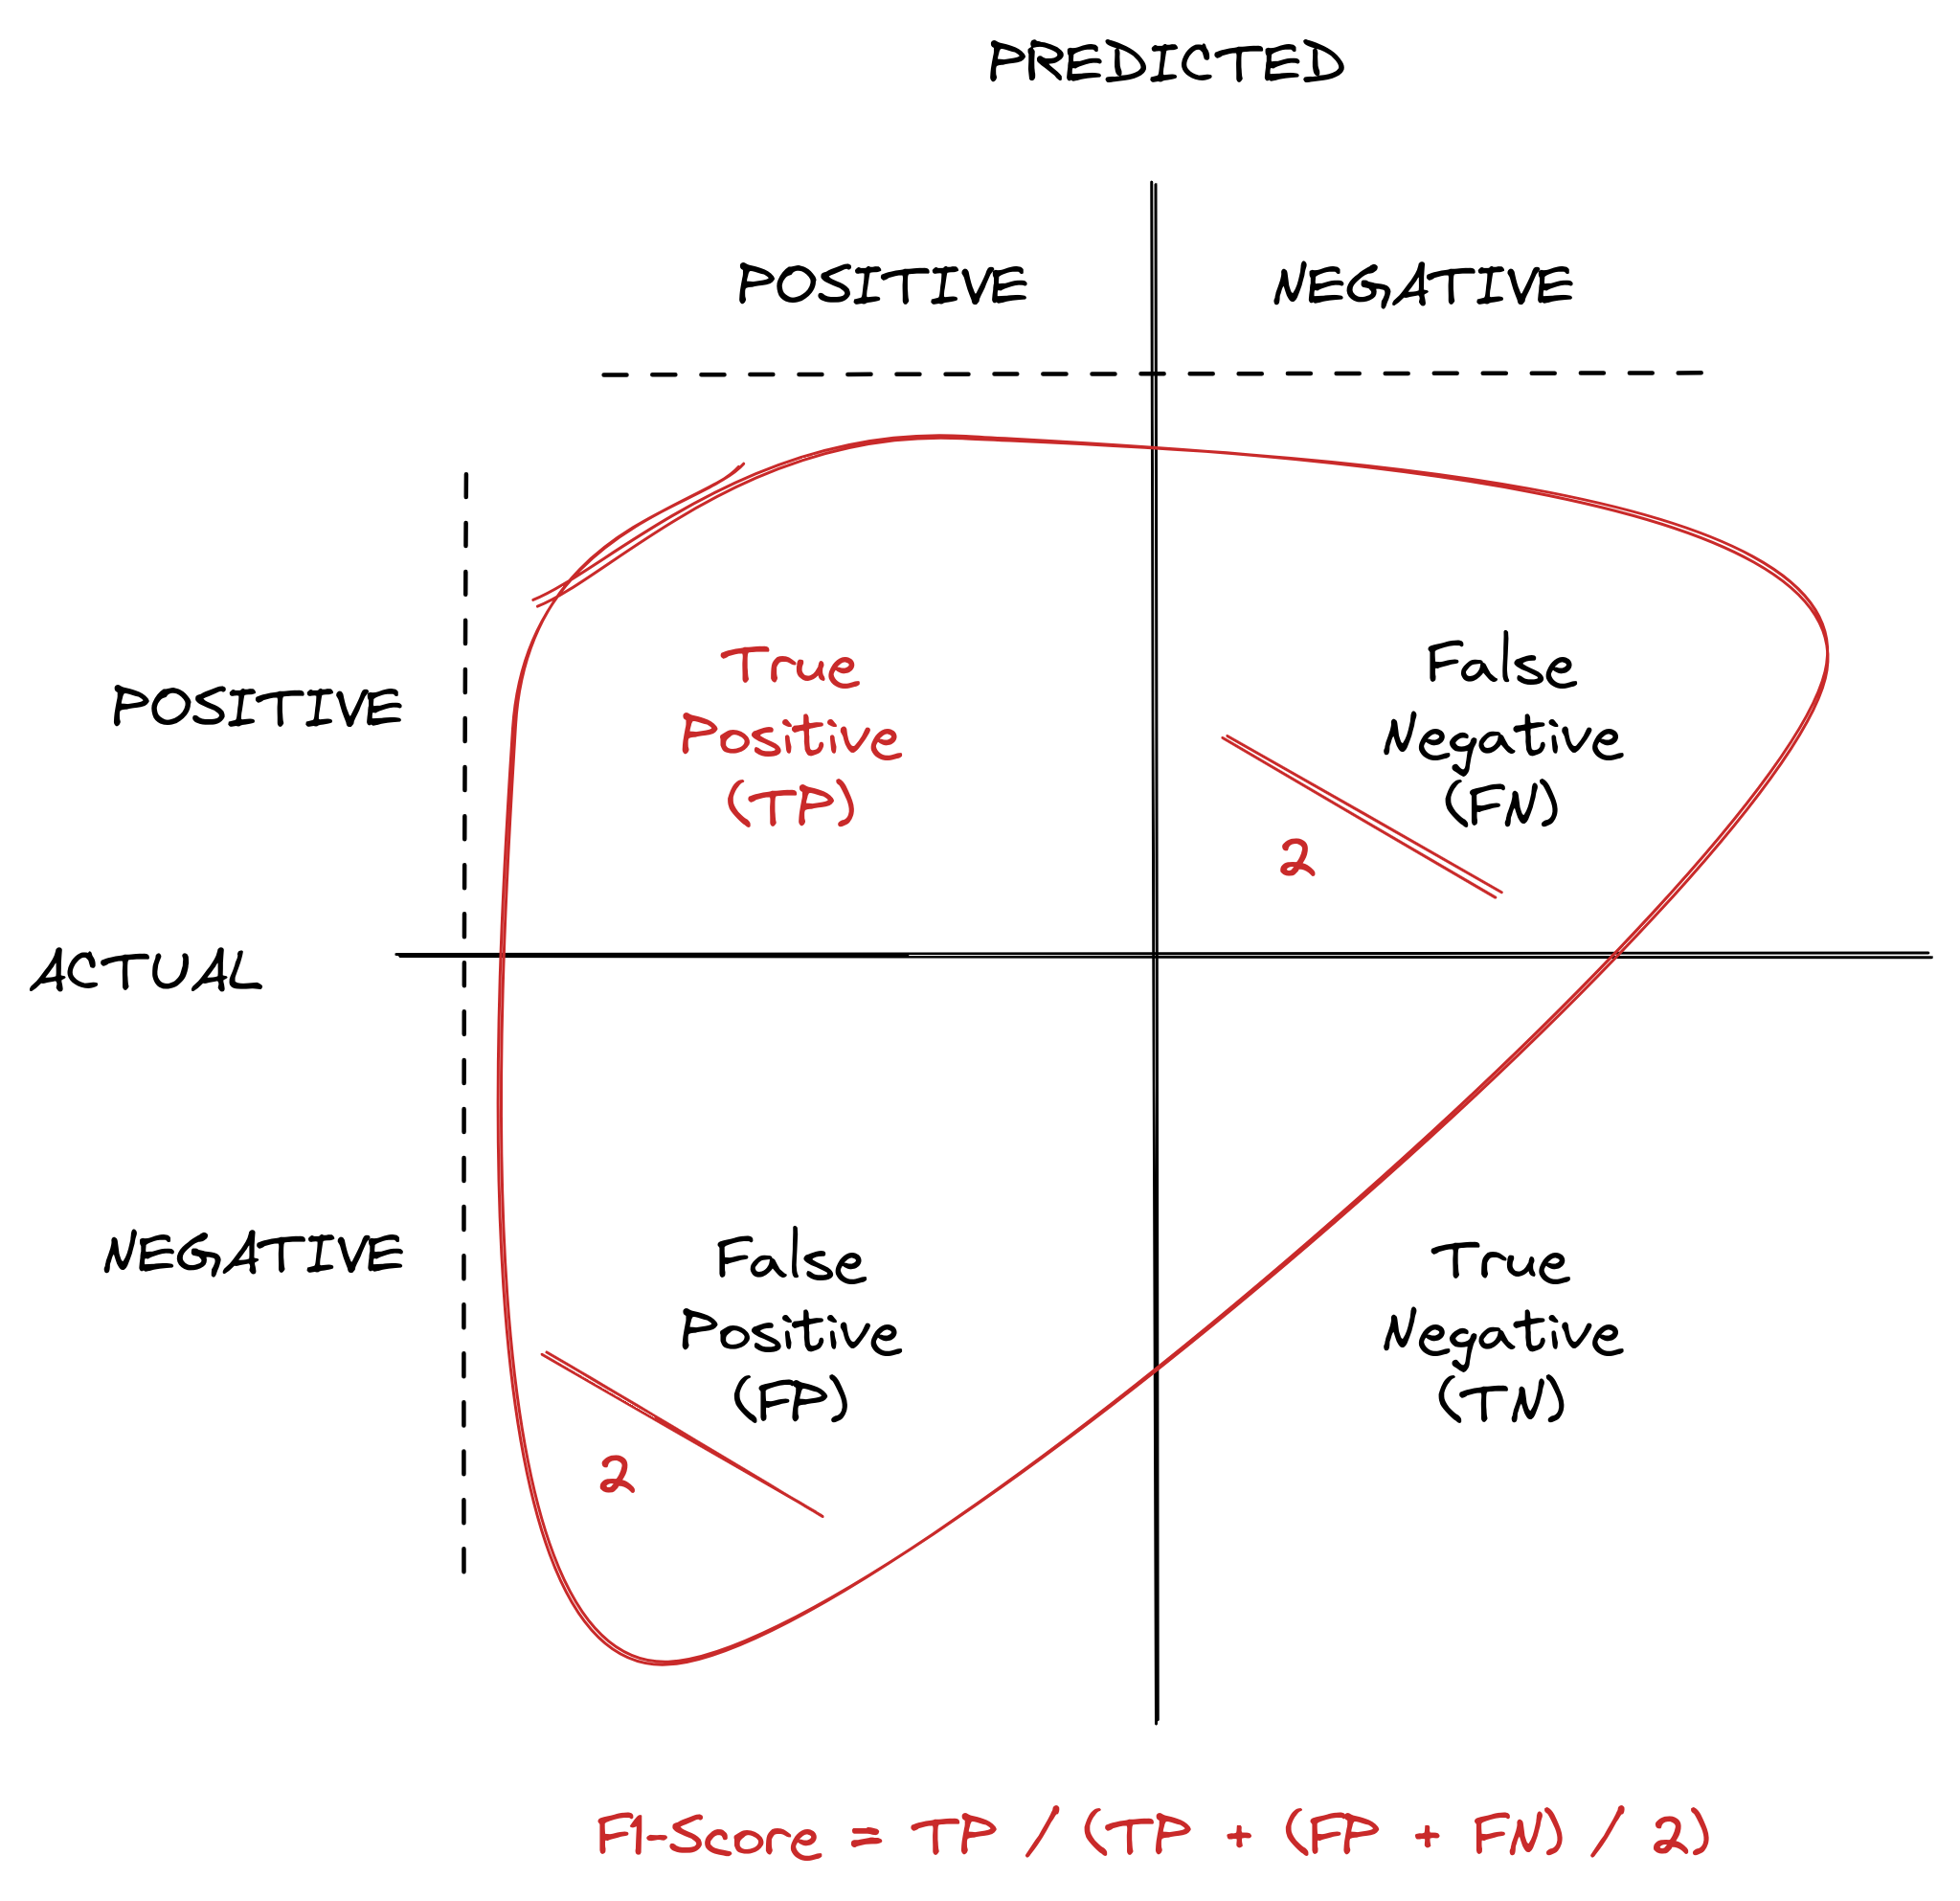
- True Positive is about how many positive samples were classified as positive.
- True Negative is about how many negative samples were classified as negative.
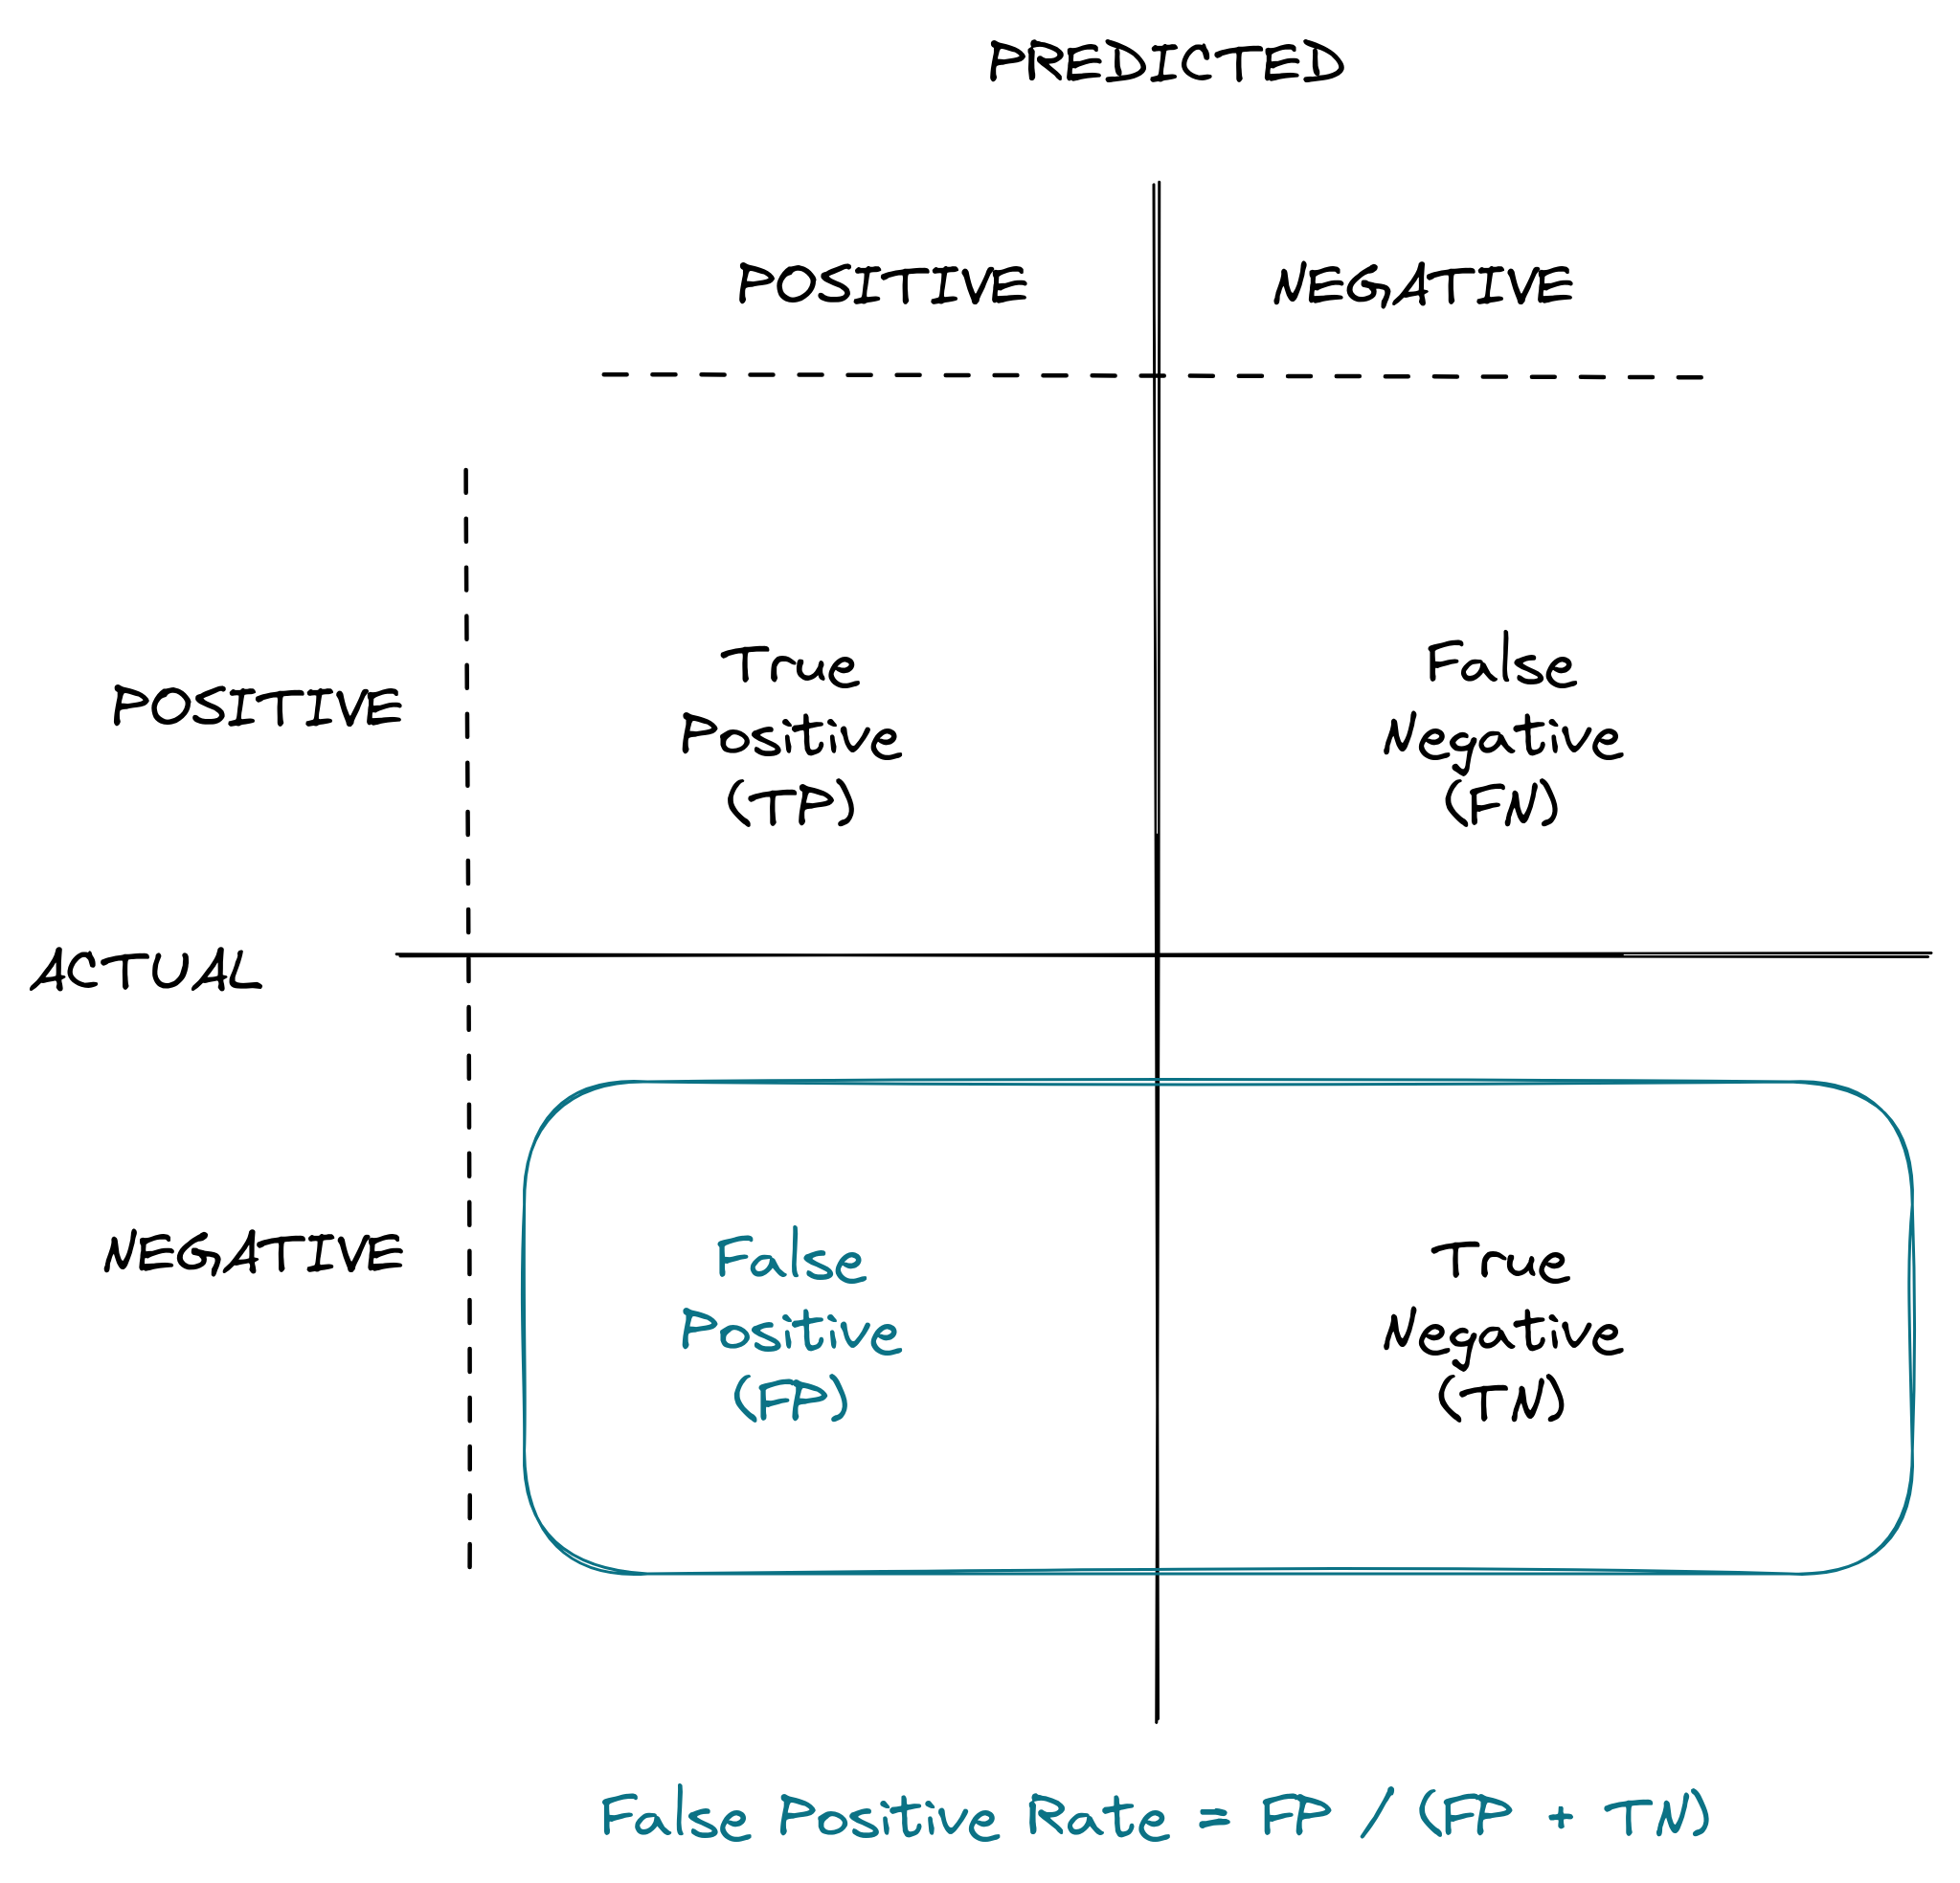
- False Positive is about how many negative samples were classified as positive.
- False Negative is about how many positive samples were classified as negative.
Accuracy
Accuracy shows how many correct classifications you have made.

Precision
Precision shows how many positive predictions were correct.

Recall
Recall shows how many predictions were correct across the only positive samples.

F1-Score
F1-Score is simply the harmonic mean between Precision and Recall.

ROC Curve
ROC Curve stands for “Receiver Operating Characteristic” and depends on two parameters:
- True Positive Rate (TPR), also known as Recall.
- False Positive Rate (FPR), which is the probability of an actual negative class to be predicted as positive.

Using different threshold values from 0 to 1, a ROC Curve is created by plotting FPR values on the X-axis, and TPR values on the Y-axis.

AUC
AUC stands for “Area under the ROC Curve” and measures the entire two-dimensional area underneath the entire ROC curve from (0,0) to (1,1).

Conclusion
These metrics are widely used in different machine learning topics, so it is required to get a clear intuition about how they work, how to interpret, and, finally, how to raise them to 100%.